By Sarah Beth Thompson, Bailey Ellison, Wesley Porter
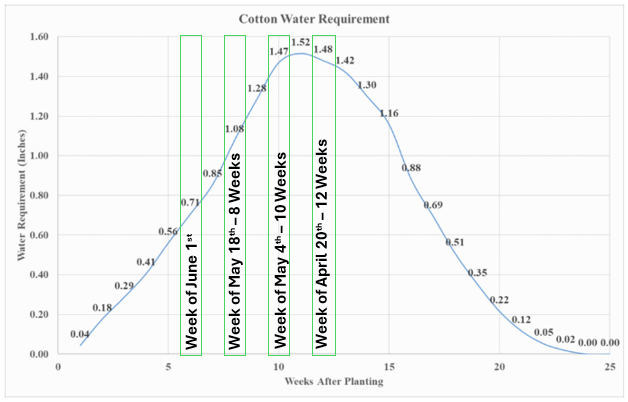
Last week, Mr. Ross Greene updated the blog on peanut water demand increasing, and this week we wanted to provide a closer look into cotton as water requirements increase. Based on early to late season planting date ranges, cotton water usage has already started or will start to increase soon. Below we have highlighted a few select planting dates in two week increments and where water requirements are estimated to be based on those dates. A mid-to-late April plant date will have just passed right over peak water use, requiring around 1.5 inches of irrigation/rainfall per week. A plant date around the June 1st mark is currently requiring around 0.75 inches per week and will be moving into peak water use soon. Peak water usage in cotton is crucial to stay on top of for boll development, lint quality, and maximizing yield potential.
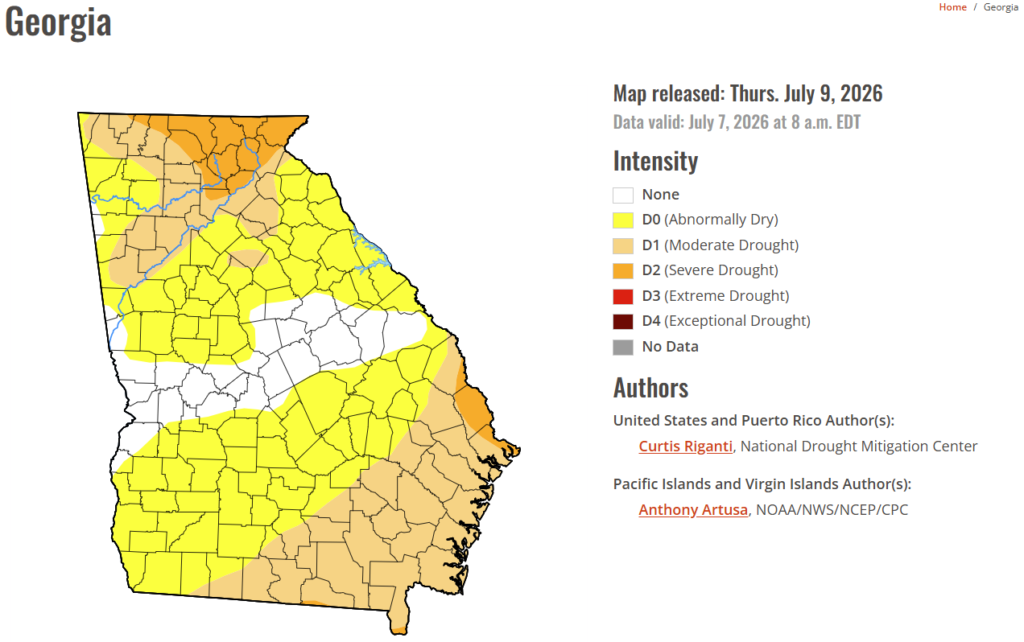
Starting off the season, we experienced both extremes of dry and saturated soil conditions from receiving over 10 inches of rainfall in a month in some places. The vast majority of our cropped land in the southern half of that state is at an abnormally dry to moderate drought state as shown in the drought monitor map for Georgia. While this is better than we have been in, it is still hot, and has been dry in many areas driving up water requirements and even making it difficult to keep up with irrigation requirements in many instances. For specific information about your county, view Georgia’s Drought Monitor.
As a result of the drought conditions, the soil water profile may have been temporarily restored but has been rapidly depleted with recent heat and lack of consistent rainfall. Thus, stored soil moisture levels are at little to none. Without the stored soil moisture, missed irrigation cycles coupled with no rainfall can be detrimental to the crop. If irrigation falls behind during this period, yields will suffer, and it will be hard to recover later in the season. Research has shown that once cotton begins to wilt, physiological stress has already occurred, and yield potential is lost. Additionally, if you wait to see the stress, and there is no rainfall, it is nearly impossible to replenish the soil moisture profile with irrigation alone. It is more efficient and effective to maintain the soil moisture levels at adequate levels rather than to try to catch up after the plant has become stressed. Another thing to consider when deciding how much to irrigate, is your irrigation systems capacity and efficiency. For example, during peak water usage, cotton can use up to 0.3 inches of water per day. An irrigation system operating at 85% efficiency will need to apply 0.35 inches of water to replace one day of crop water use. Thus, over a 2-to-3-day period 0.7 to 1.05 inches of irrigation would be required to adequately replace the used water.
Across the state
Currently, we have soil moisture sensors installed in cotton research fields located in Perry, Camilla, and Midville, GA. We have included a few graphs of what the sensor readings are and brief details of the treatment they are installed in to show the current soil moisture status across the southern region of the state.
Midville, GA
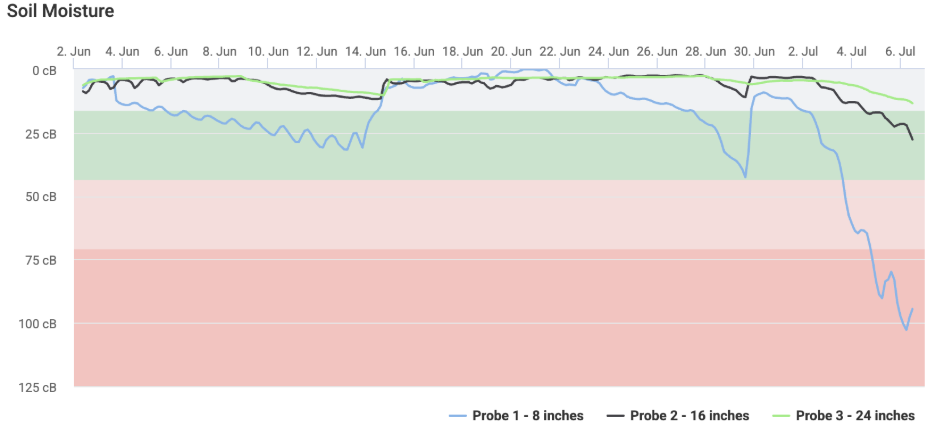
This trial was planted on May 19th with sensors installed on June 2nd. This sensor, which graph is shown below, is installed in a cover crop trial featuring cotton as the cash crop, and the cover mix being clover, rye, oats, radish, and vetch. From May 19th to July 6th, this field has received around 10.66 inches of rain. With roughly 5 inches of that total resulting in the time frame between June 14th and June 19th. On this graph, you can see a steady hold at a saturated soil condition and a slow taper into drier values as we moved into July. There is a slight spike around June 29th because of a 0.75-inch rain event. Moving to current conditions, the field is starting to increase in water demand through early flowering and bloom, hotter temperatures, and higher evapotranspiration rates.
As you look a little bit closer at the black (16-inch) and green (24-inch) lines on the graph in July, we start to see them trailing behind the blue (8-in depth). This slow increase to drier soil conditions in the bottom depths is something we saw a little bit later in the season last year as the drought started to occur. This is telling us that the bottom depths cannot replenish as fast as the roots are extracting from the deeper root zone, and irrigation alone cannot infiltrate fast enough to stay on top of demand. This story will especially be apparent this year since we started out the season from a very dry winter and early spring with little to no water banked deeper in the soil for the roots to pull from.
The blue line (8-in depth) in early June shows a daily drawdown. This is very common in the shallow depth and represents what few kilopascals the plants are extracting and/or evaporating during the day while decreasing during the night. A similar trend is shown in the black line (16-in depth) in July, meaning the drawdown is also occurring deeper and extracting more water than it was a month ago. For this reason, this is why we use a weighted average to try and encapsulate this picture and can similarly be seen in the graph from Camilla, GA.
Camilla, GA
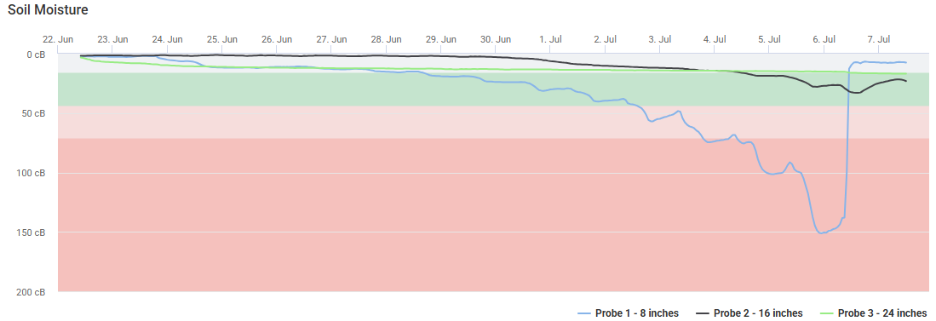
This trial was planted later in the season on June 5th, and the sensor graph highlighted is installed in the static season long 45 kPa irrigation threshold trigger. This treatment represents the current recommendation for cotton if using soil water tension sensors. Since June 5th, this field has received around 5.33 inches of rain. This field triggered an irrigation event on July 6th, as this field is approaching peak water usage. The response to a 0.75-inch irrigation event is shown from the shallowest depth reading from around 150 kPa to under 10 kPa.
Since the Camilla trial was planted about three weeks later than the Midville trial we do not see much water usage at the 16- and 24-inch depths yet. This tells me that that we do not have significant root growth and extraction at these depths. However, this will start to happen soon as the crop matures and moves into squaring and flowering. Deep extraction will begin and without adequate rainfall, these depths will be depleted and not replenished with irrigation alone.
Perry, GA
This trial was planted on May 19th and has received 7.99 inches of rain since planting. These sensors were installed during late June and displayed a slow taper in the 8-inch depth while still in a fairly saturated state. The drawdown as mentioned before is not as apparent yet in this graph since more rainfall has been received at this location.
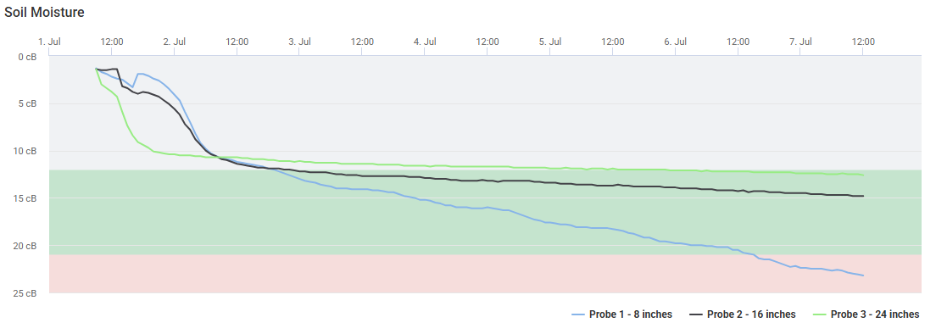
In comparison and taking only rainfall and planting date into account, the Midville and Perry, GA sensor readings visually show the difference three inches of rain can make during peak water usage. The Midville 8-inch sensor is sitting at 100 kPa (dry soil condition), and the Perry 8-inch sensor is at a climbing 20 kPa (saturated soil condition).
The field examples from Midville, Camilla, and Perry show how much of a difference planting date and rainfall distribution coupled with crop water requirement can make. As water demand increases during flowering and boll development, proactive irrigation management becomes increasingly important. For more information on cotton irrigation or irrigation scheduling, contact your local University of Georgia Extension office.
For reference, specifically cotton, the weighted averages we currently use in respect to days after planting are listed in the table below. These are just meant as a guide. I strongly suggest you monitor root development and moisture extraction and adjust sensor weighting appropriately for your individual conditions.
| Days after Planting (DAP) | 8 in depth | 16 in depth | 24 in depth |
| 0 to 31 DAP | 0.6 | 0.3 | 0.1 |
| 31 to 60 DAP | 0.4 | 0.4 | 0.2 |
| 61 DAP to Irrigation Termination | 0.3 | 0.5 | 0.2 |