By Ross Greene (Evans and Candler County ANR Agent), Bailey Ellison, Sarah Beth Thompson and Wesley Porter
Every year is different and brings its own challenges. The end of the 2025 and the beginning of the 2026 season have been very dry, honestly drier than we have seen in the 2000’s. We have started to receive rainfall, but we have not fully recovered from the drought conditions. Up to this point, it is a temporary fix. Hopefully, we will continue to receive rainfall and move out of the drought. If it helps to bring it into perspective, for the first time since October the Floridan Aquifer Drought Notification System has reached Condition Yellow as opposed to Red. For more information on this status please the Blog Post back from October here: Floridian Aquifer Status for Drought Restricted Permit Holders.
Hopefully, the status will remain above Red, but that will all depend on rainfall, usage, and recharge. More information on the Georgia Drought Status in general and across the state please find information here. The Drought Indicators Reports provide great information about surface and sub-surface water levels, and even comparisons to the previous recent drought years of 2007 and 2011.
Now as we move into the production season, it’s time to ensure that you have a solid irrigation scheduling plan in place. Many irrigation systems that would normally be considered adequate in a typical year have been showing signs of not being able to keep up with crop water demands under the drought conditions. While we do have access to adequate water supply across Georgia on the average, we usually have adequate levels of rainfall, thus, our irrigation recommendations are more supplemental to rainfall and stored soil moisture. This year, however, we had very little subsoil moisture reserve. Once crops entered peak growth stages, irrigation essentially became the only water available to the plants.
We can document this through the UGA Weather Network Water Balance Calculator.
The following tables are for January 1, 2026 – June 1, 2026.
Donalsonville
| From January-1 | To June-1 | Total Precipitation (in) | Evapotranspiration (in) | Water Balance (in) |
|---|---|---|---|---|
| 2026 | 2026 | 20.05 | 17.75 | 2.3 |
| 2025 | 2025 | 22.35 | 18.11 | 4.24 |
| 2024 | 2024 | 27.09 | 17.42 | 9.67 |
| 2023 | 2023 | 24.46 | 16.93 | 7.53 |
Tifton
| From January-1 | To June-1 | Total Precipitation (in) | Evapotranspiration (in) | Water Balance (in) |
|---|---|---|---|---|
| 2026 | 2026 | 16.56 | 17.92 | -1.36 |
| 2025 | 2025 | 15.5 | 17.31 | -1.81 |
| 2024 | 2024 | 27.54 | 16.91 | 10.63 |
| 2023 | 2023 | 19.49 | 16.41 | 3.08 |
Midville
| From January-1 | To June-1 | Total Precipitation (in) | Evapotranspiration (in) | Water Balance (in) |
|---|---|---|---|---|
| 2026 | 2026 | 17.23 | 17.6 | -0.37 |
| 2025 | 2025 | 18.24 | 17.77 | 0.47 |
| 2024 | 2024 | 23.84 | 16.34 | 7.5 |
| 2023 | 2023 | 23.1 | 15.34 | 7.76 |
While these tables provide a snapshot of where we are up to June 1 for the year, they do not tell all of the story. It’s important to note how far behind on rainfall we have been since last fall. These data show that we were dry last spring also, but in the past few years, we have a much greater amount of rainfall during the same time period. This should help to put it into perspective on how far behind we are in not only rainfall, but from the perspective of soil moisture. It was evaporated out over the dry periods and has not been fully replaced.
Thus, these very dry conditions have caused many issues in the soil. In many cases we have either seen or heard about the extremely dry soils surrounding wetted zones pulling moisture away much faster than normal. Combined with low humidity, wind, and high temperatures, irrigation applications were not lasting as long as they normally do in the soil profile. In some cases, growers were applying what would normally be considered adequate irrigation, but crops were still experiencing stress because the entire soil profile was depleted, and evaporative demand remained extremely high.
For example, with the onion crop, we may not have fully realized what was happening until yield losses had already occurred. Some of the reduced yields were likely related to cold injury, but drought stress and irrigation limitations contributed more than we initially realized. Watermelons are starting to observe similar concerns, especially in drip-irrigated fields. Some growers are reporting having to run irrigation systems substantially longer than normal just to maintain adequate moisture in the profile. Some watermelon fruit abortion during periods of intense heat and drought stress has been observed, which is not commonly seen to this extent. Many of these issues that are showing up again relate back to the lack of soil moisture throughout the profile. Let’s revisit the water balance again, while it’s obvious that we have not been receiving rainfall, what the water balance shows us is that we have lost more moisture through evaporation/evapotranspiration. Due to this when we planted our crops and started irrigating them, we spent a greater amount of irrigation water refilling the soil profile instead of just being readily available for the crop. Thus, in our current situation, we are not just trying to match the irrigation requirements to the crop, but we are actually working to refill the dry profile. Again, not to be too negative, we have started to receive rainfall recently and are working to meet crop demands and replenish the soil moisture profile.
However, when move back to the discussion about a dry profile in the crop production season another concern is overall irrigation capacity. Many farms are designed around irrigation, supplementing rainfall, not completely replacing rainfall for extended periods. Some irrigation ponds had reached critically low levels, and in some situations, systems simply do not have the capacity to rotate across enough acreage rapidly enough to keep up with crop demand.
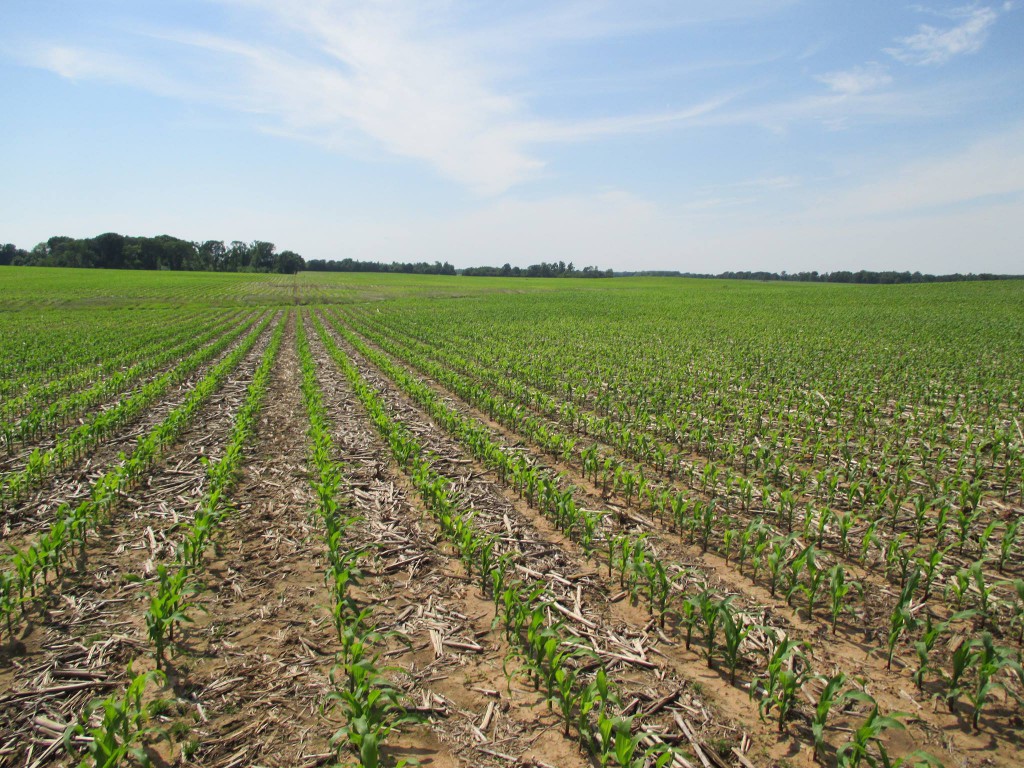
In corn, as water demand increases during tasseling and grain fill, we may begin to see similar issues. Growers who are experiencing a dry period may need to irrigate more frequently or heavier than normal to maintain normal yields, as system capacity is capable. Prolonged drought, depleted subsoil moisture, high evaporative demand, and irrigation system limitations can create situations where “normal” irrigation practices are no longer sufficient. In addition to creating situations where “normal” practices are not sufficient, situations where the irrigation system does not have adequate supply or is not applying irrigation uniformly will become obvious visibly and through yield data.
Currently
As stated earlier, we have received rainfall over the past few weeks. The following charts are the same weather stations we utilized previously to show how the rainfall in May (May 1 – June 1) has helped to alleviate some of the drought conditions.
Donalsonville
| From May-1 | To June-1 | Total Precipitation (in) | Evapotranspiration (in) | Water Balance (in) |
|---|---|---|---|---|
| 2026 | 2026 | 10.96 | 5.33 | 5.63 |
| 2025 | 2025 | 4.69 | 6.02 | -1.33 |
| 2024 | 2024 | 8.36 | 5.95 | 2.41 |
| 2023 | 2023 | 3.69 | 5.58 | -1.89 |
Tifton
| From May-1 | To June-1 | Total Precipitation (in) | Evapotranspiration (in) | Water Balance (in) |
|---|---|---|---|---|
| 2026 | 2026 | 7.58 | 5.72 | 1.86 |
| 2025 | 2025 | 2.69 | 5.81 | -3.12 |
| 2024 | 2024 | 7.66 | 5.72 | 1.94 |
| 2023 | 2023 | 3.03 | 5.39 | -2.36 |
Midville
| From May-1 | To June-1 | Total Precipitation (in) | Evapotranspiration (in) | Water Balance (in) |
|---|---|---|---|---|
| 2026 | 2026 | 6.66 | 5.51 | 1.15 |
| 2025 | 2025 | 5.46 | 5.61 | -0.15 |
| 2024 | 2024 | 5.74 | 5.6 | 0.14 |
| 2023 | 2023 | 4.5 | 4.88 | -0.38 |
Depending on location, for the month of May, we are ahead on the water balance. Keep in mind however, we are still behind from last fall. Either way, this rainfall has been timely, and has been received as corn has moved into tassel and peak water usage.
Thus, when taking into consideration the total precipitation and evapotranspiration rates in your area, it is crucial to monitor both to better track water balance throughout the season, especially in a drought. The total precipitation in the month of May has been all over the board in the southern portion of the state, and the evapotranspiration values have ranged from 4.1 to 4.7 inches.
If your area was not highlighted in these few weather stations, please click the button below to find a weather station closer to you.
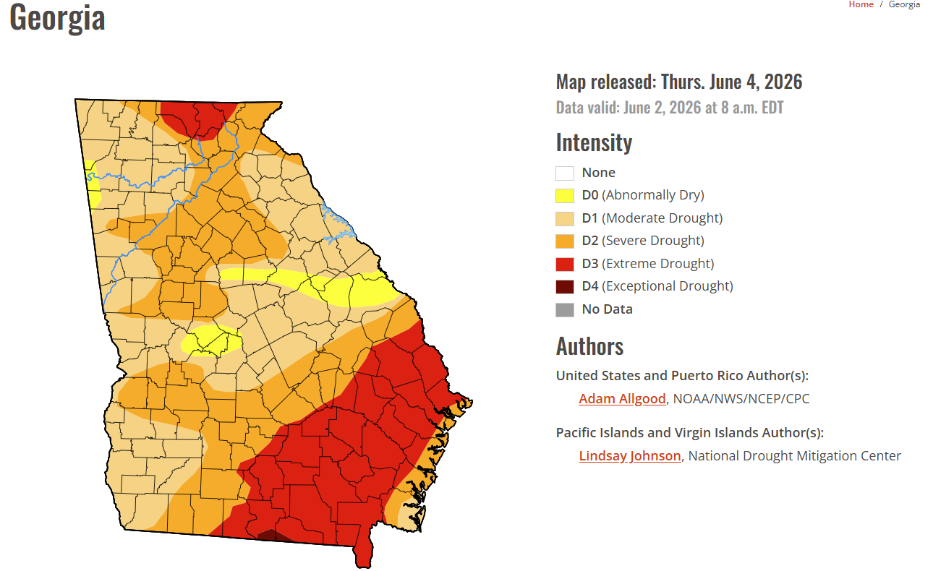
US Drought Monitor
Drought is divided into five categories based on the intensity and influence on agriculture:
- D0 (Abnormally Dry): Soil moisture begins to decline, increasing the risk of fire, and potentially delaying planting.
- D1 (Moderate Drought): Water levels in ponds, streams, and rivers begin to decrease, while crops become more susceptible to stress.
- D2 (Severe Drought): Crop stress becomes noticeable, and small areas of water begin to dry up.
- D3 (Extreme Drought): Agricultural losses begin to occur as ponds become dry, and wells begin to dry up.
- D4 (Exceptional Drought): Agricultural economy is majorly impacted, and wildfires become a major risk.
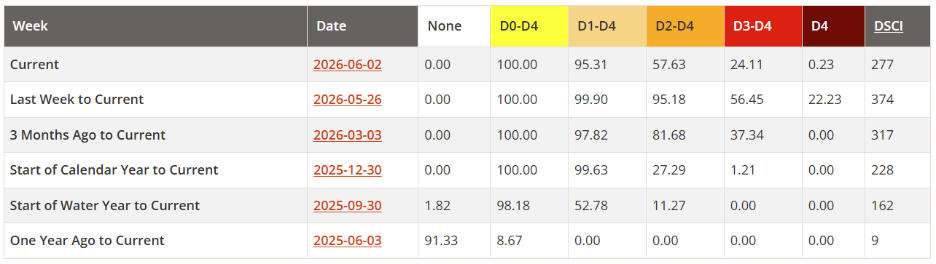
The U.S. Drought Monitor still shows the entirety of Georgia in a drought category.
When comparing the past week to the current week, the rainfall that has been received over the past week has allowed 20% of the state to improve from D4 (Exceptional Drought) to D3 (Extreme Drought). Despite the improvement, 24% of Georgia remains in an extreme drought.
Monitoring the drought in your area is crucial to protecting your crops, managing your water use, and maintaining safety on your operation. To view specific insights on your county, click here. As always if you have questions, please reach out.